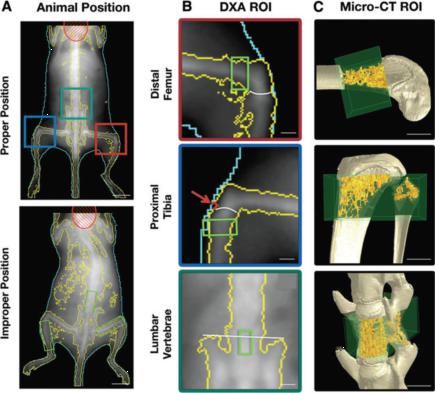
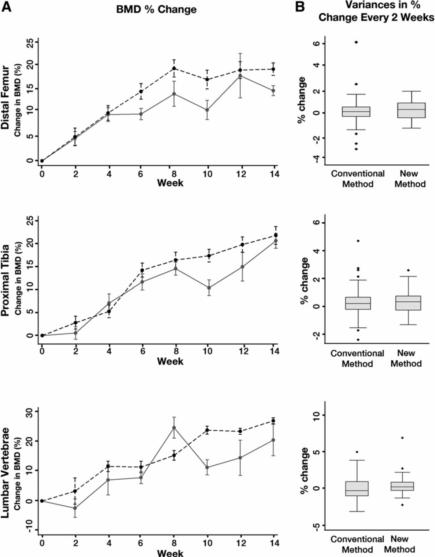
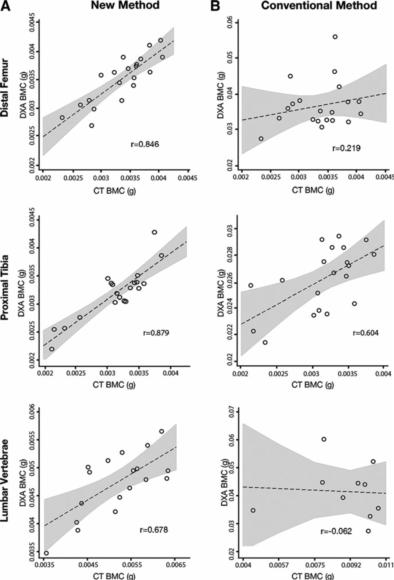
A new guideline for the analysis of mouse trabecular bone rich areas by dual-energy X-ray absorptiometry Osteoporosis has become one of the six most common diseases in the world. It is reported that 90 million people in China suffer from different degrees of osteoporosis. Osteoporosis has become a common disease in middle-aged and elderly people. Measuring the amount of minerals in human bones is very necessary for middle-aged and elderly people, especially urban residents over 40 years old, especially middle-aged women. Calcium deficiency is more serious. Trabecular bone is often studied in osteoporosis studies because changes in trabecular bone are the most common cause of osteoporotic fractures. Dual energy X-ray absorptiometry (DXA) provides accurate measurements of the trabecular bone rich area. In preclinical studies in this field, DXA has been widely used for the measurement of bone mineral density (BMD) and bone mineralization (BMC) in small animal metabolic bone disease research, compared with micro computed tomography (CT). Simple, fast, low radiation. In clinical studies, accurate localization and image analysis of DXA measurements of BMD is critical to the diagnosis. Improper DXA analysis can lead to erroneous diagnosis and treatment. As with human DXA studies, DXA studies of small animals may be greatly affected by improper positioning. Therefore, it is very important to obtain high quality images in longitudinal studies to evaluate the results. Currently, in the evaluation of DXA images of mouse BMD, no standardized guideline can be accurately located in the trabecular bone rich region; at the same time, there is no relevant mouse localization standard during DXA scanning. In light of this, UCLA-related researchers have developed a standard method for accurate DXA analysis of trabecular bone rich areas. This will increase the efficiency of longitudinal studies of DXA in metabolic bone disease. In histological analysis, the researchers defined four lines between the distal femur and the proximal tibia: the first line was on the longitudinal axis of the femur or the longitudinal axis of the tibia; the second line was from the end of the femur or tibia. And a line perpendicular to the first line; the third line starts from the nearest end point on the femur, to the farthest end of the tibia and parallel to the second line; the fourth line connects the front and rear edges of the raft. By measuring the distance between the "second line" and the "third line" and the angle between the "third line" and the "fourth line", the distance between the epiphyseal plate (EPD) and The angle of the epiphyseal plate (EPA). To determine the position of the tibia in the DXA analysis of the distal femur, the kneecap distance (PD) was measured after the knee was bent to 90 degrees (Fig. 1). Figure 2: Mouse localization and ROI selection in DXA and CT Next, DXA imaging was used in the study to show the correct position of the mouse, and the inappropriate position of the mouse was examined during the traditional method of detecting trabecular bone. In the DXA imaging results, the authors presented the ideal ROI position for the distal femur, proximal humerus, and lumbar spine. A series of new detection methods have been proposed: (1) mice fasted overnight to prevent calcified foods from affecting imaging results. (2) Clean the entire imaging area to avoid interference caused by animal feces, fur, etc. (3) The mouse is placed prone in a circular groove of the specimen disk. (4) Make sure that the tail of the mouse does not cover any long bones. (5) Move the mouse's leg away from the body. (6) Apply gentle traction to the tail and back to straighten the spine and ensure that the skull is parallel to the sagittal plane. (7) Keep the front leg and the spine at an angle of 45 degrees to prevent image overlap. (8) Outreach femur. (9) Adjust the knee position to a 90 degree angle. (10) DXA scans each image and rescans poor quality images. To verify the accuracy of the DXA analysis, the authors also compared BMC obtained with DXA and BMC obtained from CT imaging. The results showed that the ROI region of CT covered the trabecular bone and cortical bone, including the same ROI results as selected in DXA imaging. (Figure II). Figure 3: Longitudinal comparison of DXA BMD in the distal femur, proximal humerus, and lumbar spine at 0-14 weeks Figure 4: Correlation analysis between DXA BMC and CT BMC Finally, the authors compare and analyze the traditional methods and new methods for measuring the trabecular bone rich region. The new DXA method has a lower coefficient of variation than the traditional method, and the extreme values ​​are also less (Figure 3, Figure 4). Therefore, the traditional DXA BMD acquisition method cannot be used as a reliable method to track changes in mouse bones. In this study, the authors explored a new method for DXA BMD measurement. The distal part of the femur, the proximal humerus and the lumbar vertebrae were selected as representative areas, and the longitudinal study of the trabecular bone was developed. DXA analysis of mice yielded more accurate and accurate BMD measurements. references: Jiayu Shi, DDS, et al., Guidelines for Dual Energy X-Ray Absorptiometry Analysis of Trabecular Bone-Rich Regions in Mice: Improved Precision, Accuracy, and Sensitivity for Assessing Longitudinal Bone Changes. TISSUE ENGINEERING: Part C Volume 22, Number 5 , 2016 Operation Lamp,Wireless Ent Surgical Headlight,Surgical Dental Veterinary Head-Bend Led Light,Portable Led Shadowless Lamp Medton Medical , https://www.medton.cn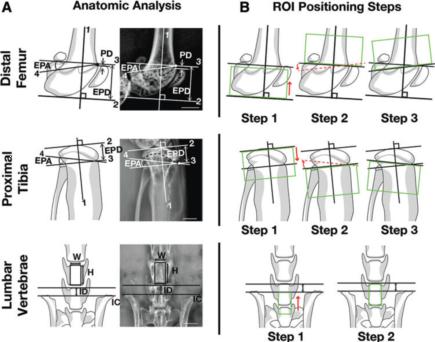
Figure 1: distal femur, proximal humerus, vertebral anatomy and DXA analysis